
The Contagion
When Geopolitical Shock Meets Portfolio Reality

Portfolio down 5.6% this week to $371,864.66. Crude at $117, biggest single-day move since 1988. Mojtaba Khamenei named new Supreme Leader Sunday — hardliner, son of the man we killed. Strait of Hormuz still closed. 20% of the world’s oil supply locked behind a chokepoint.
The thesis didn’t break. The short-term path just got brutal.
This is what holding conviction looks like when geopolitical shock hits. Not a highlight reel. Not a victory lap. A real portfolio, real losses, real transparency — and a framework that still tells you where the next move is.
The Week That Was
Friday’s close told the entire story before Sunday night made it worse. The Quiggle rankings — institutional positioning data ranked by price strength and momentum — showed where capital was flowing before the next escalation hit.
Sector Rankings — Friday March 6 Close
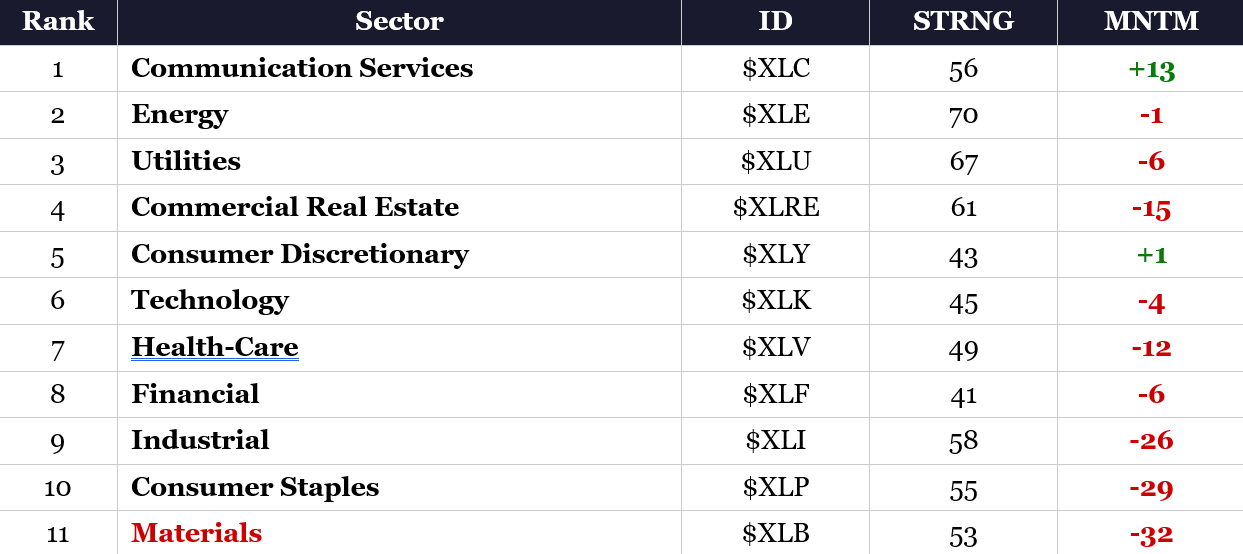
Materials dead last at #11 with -32 momentum. Energy at #2 with 70 strength. That’s not random. That’s the market telling you exactly what’s happening: crude oil surging is a tax on miners and a gift to producers. The divergence is the signal.
Industry Rankings — Top 10, Friday March 6 Close
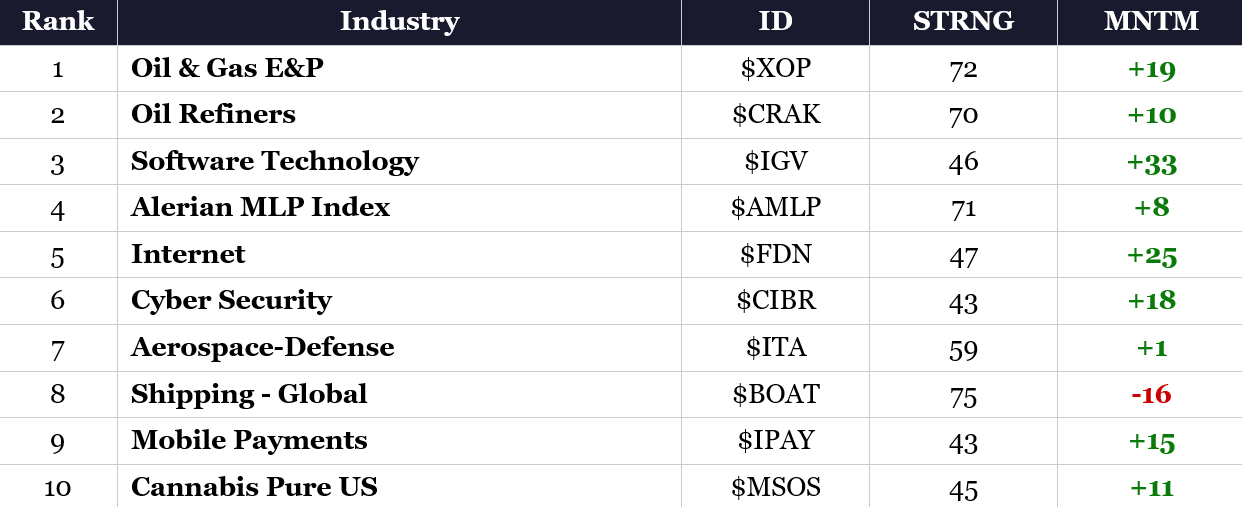
Oil & Gas Exploration #1. Oil Refiners #2. MLPs #4. That’s three of the top four industries in energy. Aerospace-Defense held at #7. Copper Miners fell to #25. The tape was screaming energy dominance and materials pain simultaneously.
Then Sunday night happened. Asian markets opened. Crude exploded past $110 to $117.58 for Brent, $116.51 for WTI. A 27% single-day spike — the biggest since at least 1988. Mojtaba Khamenei’s appointment as Supreme Leader signaled no de-escalation. He’s the hardliner son, continuity of conflict, not negotiation. Hormuz still closed. 20 million barrels per day supply deficit hitting global markets with no diplomatic offramp.
Friday’s DYRH report recorded the most violent single session of the entire series. WTI +12.21% to $90.90 that day alone. NFP printed -92,000 — the economy shed 92,000 jobs, the first negative print since October 2025. Unemployment rose to 4.4%. The worst-case macro scenario materialized: the economy is contracting while energy costs are surging with no end in sight.
The Stagflationary Twist
The yield curve is being ripped apart. This is the most analytically significant curve configuration in the entire DYRH series.
What is a yield curve? It’s the relationship between interest rates at different time horizons — how much the government pays to borrow money for 2 years versus 10 years versus 30 years. Normally, longer borrowing costs more. When the curve changes shape, it tells you what the bond market expects about the economy’s future.
Friday’s curve split in a way that confirms a stagflationary diagnosis. The front end rallied on growth fear — rate cut expectations surging. The long end sold off on inflation persistence — $91 oil with no relief in sight. The bond market is telling you the Fed cannot solve this problem.
Yield Curve Data — Friday March 6 Close

Read the table top to bottom. The 2-year yield fell 2.7 basis points — that’s the bond market pricing in rate cuts because the economy is weakening. The 30-year yield rose 0.4 basis points — that’s the bond market pricing in persistent inflation from $91 oil with Hormuz closed indefinitely.
This is not a bull flattener. This is not a bear steepener. It’s both at the same time — which only happens during supply-side stagflation shocks. The last time this curve shape appeared in textbooks was the 1970s oil crisis. The front end says recession. The back end says inflation. The Fed is trapped between the two.
Key Spread & Volatility Metrics
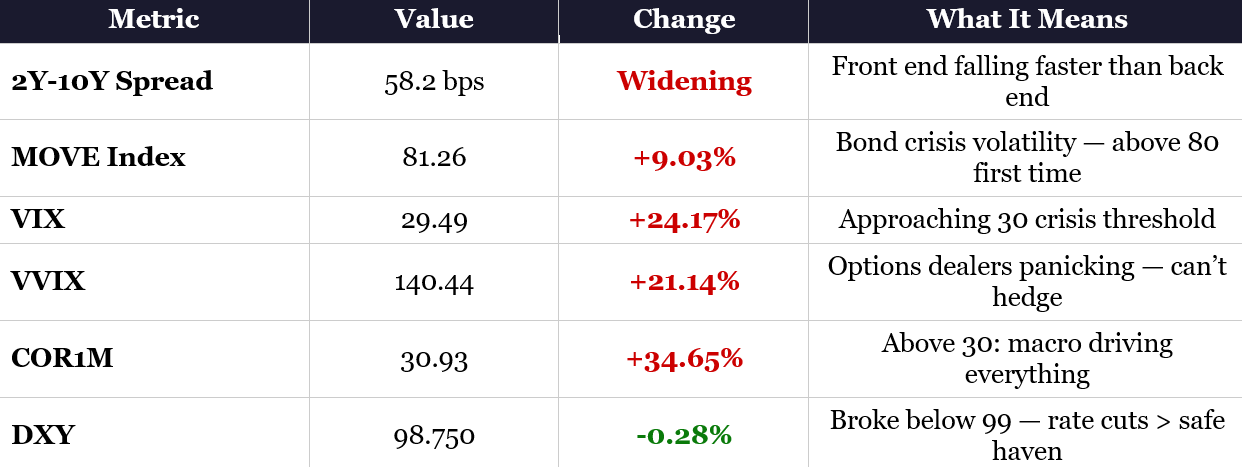
MOVE at 81.26 means the bond market is in crisis-level volatility — the first time above 80 in this series. VIX at 29.49 is one tick from 30, the level historically associated with genuine market crises. COR1M above 30 means macro is driving everything — there is virtually no stock-specific alpha available. When correlation is this high, it doesn’t matter how good the company is. The regime owns the tape.
And DXY breaking below 99 is the critical signal. The dollar flipped from war-era strength to weakness as -92K NFP overwhelmed the safe-haven bid with rate cut expectations. Your Article 1 thesis — the 60-year DXY chart pointing to the 94 FVG target — just got another confirmation. The dollar wants to go lower. The regime says it goes lower.
Why Materials Got Crushed — The Double Squeeze
Materials ranked dead last at #11 on Friday. -32 momentum. Here’s why — and it’s not one headwind. It’s two hitting simultaneously.
Headwind 1 — Crude Oil as Input Cost. Mining operations are energy-intensive. Extraction, processing, transportation — all run on oil and gas. When crude spikes from $67 to $91 in a single week (+35%), operational margins get compressed immediately. Higher crude means higher costs for every ton of copper, every ounce of gold pulled from the ground. Materials miners feel the energy shock before anyone else because it hits their cost structure directly.
Headwind 2 — Dollar Strength as Currency Squeeze. Most materials miners are not US-based. They operate in Australia, Chile, South Africa, Canada — earning revenue in local currencies but facing partially dollarized costs. When the dollar strengthens as a flight-to-safety bid (DXY hit 99.3 intraweek), those miners’ revenues get converted back at worse exchange rates. Margins compress from the currency side on top of the energy cost side.
That’s the double squeeze. Crude spiking ate margins from the cost side. Dollar strength ate margins from the conversion side. Materials got hit from both directions simultaneously — which is why it dropped to dead last while energy surged to the top.
Materials Double Squeeze — Visual

But here’s the counterpoint that matters for your positioning: this pain is short-term, not structural. When the dollar eventually reverses — which the 60-year DXY thesis from Article 1 says happens as the regime shifts — those same miners get a tailwind from both directions. Crude normalizes, dollar weakness helps conversion. The setup flips. Short-term pain, structural thesis intact.
The Defining Divergence — XLE +0.16% vs WTI +12.21%
This is the most important cross-asset signal of the week. On Friday, crude oil surged 12.21%. Energy equities gained 0.16%. That’s not a rounding error. That’s the equity market screaming that $90+ oil is demand destructive, not earnings accretive.
When energy stocks refuse to participate in an oil rally, the equity market is pricing these levels as an economic killer — oil will destroy demand before it boosts energy company earnings. This same divergence appeared in 2008 when oil hit $147 and energy stocks had already started rolling over. The equity market saw the recession coming through the energy complex before the headlines caught up.
This week’s divergence reached extremes: XLE actually turned negative on Thursday despite crude surging 8.5%. Friday’s 0.16% gain on a 12% oil move was barely positive. The cumulative message is clear — crude at these levels is a tax on the global economy, not a gift to energy shareholders.
Broad Commodity Inflation — Not Just Energy
Friday wasn’t just an energy story. The entire commodity complex lit up:

Read the table. Energy surging. Grains surging. Softs surging. That’s input costs exploding across the board. Meanwhile meat is red — cattle and hogs falling. That’s demand destruction. Input costs surging while output demand falls. That is the textbook definition of a margin squeeze. That is stagflation.
Gold’s +1.58% reversal after four consecutive days of forced-liquidation selling during a war is the key inflection. The counterintuitive signal — gold falling while bombs were literally dropping — was driven by margin calls and forced selling across portfolios. That phase is now ending. Gold vol (GVZ) declined 2.97% even as gold rallied, confirming the forced-selling dynamic has played out and gold is re-establishing its safe-haven function.
Copper at +0.04% — essentially flat — while everything else moves is the growth-fear signal within the commodity bid. Copper is the barometer for economic activity. When gold rallies and copper doesn’t, the market is pricing fear, not growth. Short-term headwind. The triple convergence thesis — military demand, AI infrastructure demand, structural mine supply deficit — hasn’t changed. But right now, crude costs and dollar strength are suppressing the vehicle while the fundamental demand drivers remain intact.
The Cross-Asset Transmission — China, Europe, and US Energy Dominance
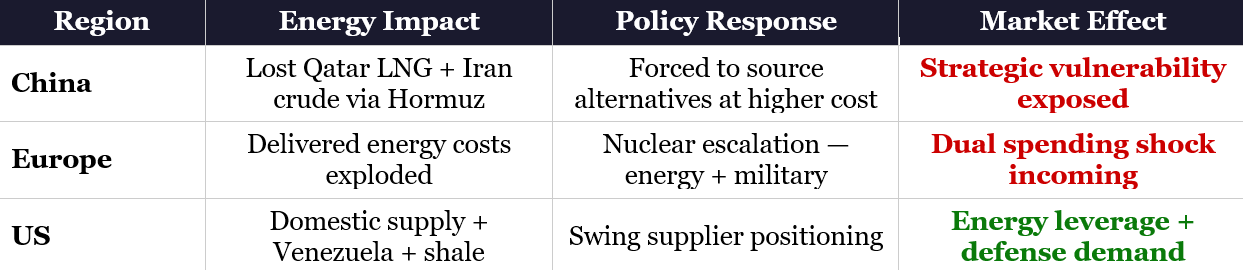
Here’s the frame that connects everything. While the US is getting hit hard, China and Europe are getting hit harder. And that relative pain is the thesis.
China’s Energy Crisis
China imports 80%+ of Iran’s oil — 1.38 million barrels per day. 50% of China’s total crude transits the Strait of Hormuz. Qatar is the world’s largest LNG exporter and 100% of that supply passes through the Strait. With Hormuz closed, China lost its cheapest energy supply overnight. Russia can’t replace the volume — they’re already at 2.07 million barrels per day to China and can’t scale fast enough. Trump sanctioned 84% of Iran’s tanker fleet and imposed 25% tariffs on countries trading with Iran. China’s strategic petroleum reserve is finite. The math doesn’t work.
Europe’s Dual Reckoning
Europe was already energy-fragile before Hormuz closed. Now their delivered energy costs have exploded. But the response this week went beyond energy — European leaders announced plans to escalate nuclear capabilities. That’s not just energy policy. That’s military strategy. Europe is realizing it cannot depend on Middle Eastern energy supply or indefinite US security guarantees. The answer: nuclear power for energy independence plus nuclear weapons for strategic deterrence. That’s a structural shift in European defense spending that wasn’t priced into any model two weeks ago.
US as Swing Supplier
Meanwhile the US has: Venezuelan reserves coming online. Domestic shale production capacity. EQT natural gas as an alternative to Qatar LNG. When Hormuz closes and China scrambles and Europe’s costs explode, the US becomes the swing energy supplier to the world. That’s not a trade. That’s geopolitical leverage. Tariffs, sanctions, and military operations all reinforce the same position — US energy dominance at the expense of net importers.
This is the regime trade from Article 1 playing out in real time. The 60-year DXY chart told you the dollar environment. The Golden Dome defense announcement — rhetoric in January 2025 — is operational reality in March 2026. Operation Epic Fury is live. Europe is rearming. China is scrambling for energy. The framework connected the dots before the dots started drawing themselves.
Cross-Asset Transmission — Who Gets Hit and How
Defense Thesis — Dual Demand Drivers
Your defense positions — RTX, BWXT, KTOS, LASR, TTMI, HWM — now have two demand drivers operating simultaneously.
Driver 1 — US Military Production Acceleration. The ammunition mathematics haven’t changed. $50,000 Iranian drones versus $3-6 million air defense missiles fired multiple times per engagement. The US cannot sustain that burn rate without production acceleration. Trump demanding “unconditional surrender” means this isn’t winding down. Defense contractors got their marching orders.
Driver 2 — European Nuclear Rearmament. Europe announced escalation of nuclear capabilities this week. That’s not just US domestic spending anymore — that’s NATO allies realizing they need to arm themselves independently. BWXT builds nuclear submarine reactors and weapons systems. KTOS builds autonomous drone systems. Europe is now a buyer of these capabilities. The addressable market just expanded across the Atlantic.
ITA (Aerospace-Defense ETF) reversed Friday — bouncing +0.90% after Thursday’s -2.81% selloff. That Thursday selloff was forced liquidation, not structural de-rating. With “unconditional surrender” as the stated policy, the war premium is back in defense names. European rearmament extends the timeline from a short-term conflict play to a multi-year structural defense spending cycle.
Gold’s Forced-Liquidation Reversal
Four days of forced-liquidation selling during an active war was the defining signal of this series. Gold is supposed to rally when bombs drop. Instead, it fell — because portfolios were being margin-called and everything was being sold indiscriminately.
Friday’s +1.58% reversal, combined with declining gold volatility (GVZ -2.97%), tells you the forced-selling phase is ending. Gold is transitioning from panic liquidation to fundamental repricing. Cumulative: gold from $5,311.60 pre-war to $5,158.70 — still net down 2.9% during a war. But the trajectory reversed. If gold continues higher this week, the margin-call phase is confirmed over and natural safe-haven flows reassert.
Silver at $84.31 (+2.59%) led all metals Friday. Silver’s dual identity — safe-haven metal plus industrial demand (60%+ of consumption) — makes it the cross-asset barometer. When silver leads gold, both fear and industrial demand are driving the bid.
Portfolio Update — Week Ending March 6, 2026

Down $22,201 this week. Down 5.6%. That’s real money. That’s parents’ retirement capital. That’s not something you gloss over.
But context matters. The S&P had its worst week since October. Russell 2000 breadth collapsed to 20.59% — just 1 in 5 stocks above their 5-day moving average. All 12 factor ETFs were red. 9 of 11 sectors were red. There was nowhere to hide except pure defensives and energy. In an environment where everything went down, the question isn’t whether you avoided the pain. It’s whether your framework gives you the roadmap for what comes next.
The framework says: crude spike is a short-term tax on your industrials and materials positions. Dollar strength is a temporary headwind on foreign-domiciled miners. Both reverse when the regime shifts. Defense demand is accelerating, not decelerating. Europe’s nuclear announcement adds a demand driver that didn’t exist two weeks ago. Gold’s forced-liquidation phase is ending. The thesis is intact. The path just got rougher.
Week Ahead — March 10-14, 2026
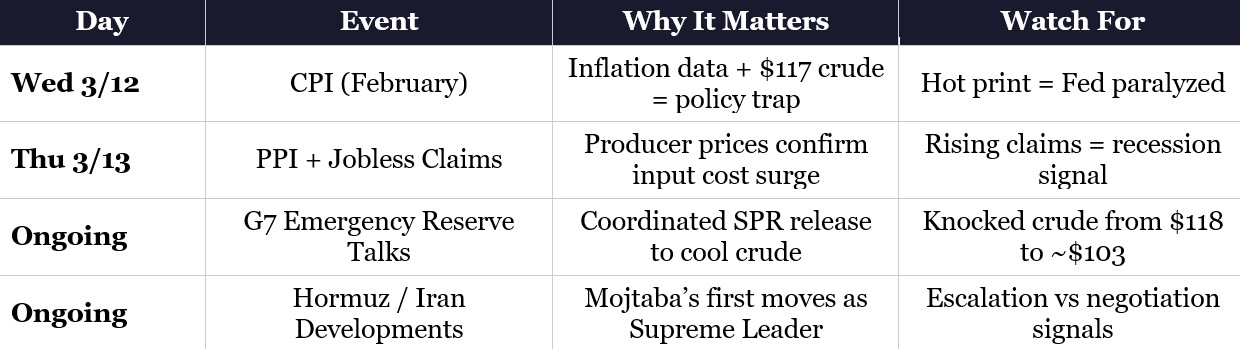
CPI on Wednesday is the print that matters most. If inflation surprises hot, real yields stay elevated and materials stay pressured. The Fed can’t cut into $117 oil — and it can’t hike into -92K payrolls. That’s the trap. If inflation surprises soft, you get temporary relief — dollar weakens, materials get a bid, the double squeeze loosens.
Watch DXY. If it breaks below 97, EM and commodity acceleration resumes. If it holds above 99, you’re in short-term disruption territory. The FVG target around 94 from Article 1 remains unfilled. The regime still points there. The path just isn’t linear.
G7 emergency reserve discussions already knocked crude from the $118 Sunday high toward $103. That tells you policy intervention is a real factor now — it’s not just one-way escalation. The market is pricing both supply shock and policy response simultaneously. That tension defines the week ahead.
The Bottom Line
Short-term pain is real. Down 5.6% this week. Materials got crushed. Industrials caught shrapnel. Dollar strength ate conversion margins on your foreign-domiciled miners.
But look at what’s happening underneath the noise. Institutions were positioned before Sunday night’s escalation. The yield curve is confirming stagflation — the exact regime that benefits the energy, defense, and precious metals thesis. Europe is rearming. China is scrambling. The US is positioning as the swing energy supplier to the world.
Your crude oil thesis from Article 1 — the one you took losses on, the one you admitted was early — just printed $117 Brent. Thirteen months after Liberation Day. Early, not wrong.
Your defense thesis — built in Q3-Q4 2025 because the regime pointed there — now has dual demand from US production acceleration and European nuclear rearmament. Your energy thesis — EQT as the alternative to Qatar LNG — is being confirmed in real time as Hormuz stays closed.
The framework isn’t broken. The short-term path is painful. The process holds.
Process over prediction. The data tells you where the regime is going. The question is whether you hold through the noise or panic into the headlines.
— 34 Macro
Glossary
Stagflationary Twist: A yield curve shape where the front end falls (pricing rate cuts / recession) while the long end rises (pricing inflation persistence). Indicates the central bank is trapped between two competing forces.
MOVE Index: Measures expected volatility in the US Treasury market. Above 80 indicates crisis-level bond market stress.
COR1M: 1-month implied correlation across S&P 500 stocks. Above 30 means macro is driving everything — individual stock selection provides no diversification benefit.
VVIX: Volatility of volatility — measures how much the VIX itself is moving. When VVIX spikes, options dealers are struggling to hedge their own positions, which often precedes further VIX increases.
Double Squeeze: When a sector or company faces margin pressure from two directions simultaneously — in this case, rising input costs (crude oil) and unfavorable currency conversion (dollar strength).
Demand Destructive: A price level so high that it reduces economic activity rather than boosting producer profits. When energy equities don’t follow oil higher, the market is telling you oil prices are demand destructive.
Forced Liquidation: When investors are forced to sell assets — not because they want to, but because margin calls or portfolio risk limits require it. This can cause safe-haven assets like gold to fall during crises.
Swing Supplier: The producer with enough spare capacity and flexibility to increase or decrease supply to influence global prices. In this context, the US is becoming the swing energy supplier as Middle Eastern supply is disrupted.
GVZ: Gold Volatility Index. When GVZ declines while gold price rises, it signals that the chaotic forced-selling phase is ending and gold is entering a more orderly trend.
FVG (Fair Value Gap): A price imbalance on a chart where price moved so aggressively that it left an unfilled zone. Price tends to return to these zones over time. The DXY FVG target around 94 from Article 1 remains unfilled.
34 MACRO
Cross-asset macro research and education — built for the everyday person.
The information on this website/Substack is for information purposes only. It is believed to be reliable, but 34 Macro does not warrant its completeness or accuracy. The information on the website/Substack is not intended as an offer or solicitation for the purchase of stock or any financial instrument. The information and materials contained in these pages and the terms, conditions and descriptions that appear, are subject to change without notice. Unauthorized use of 34 Macro websites and systems including but not limited to data scraping, unauthorized entry into 34 Macro systems, misuse of passwords, or misuse of any information posted on a site is strictly prohibited. Your eligibility for particular services is subject to final determination by 34 Macro and/or its affiliates. Investment services are not bank deposits or insured by the FDIC or other entity and are subject to investment risks, including possible loss of principal amount invested. Your use of any information which is proprietary to 34 Macro or a third-party information provider shall only be used on individual devices without any right to redistribute, upload, export, copy, or otherwise transfer the information to any centralized interdepartmental or shared device, directory, database or other repository nor to otherwise make it available to any other entity/person/third party, without the prior written consent of 34 Macro.
Subscribe at 34macro.substack.com