
The Liquidity Crisis
When Even Safe Havens Aren't Safe

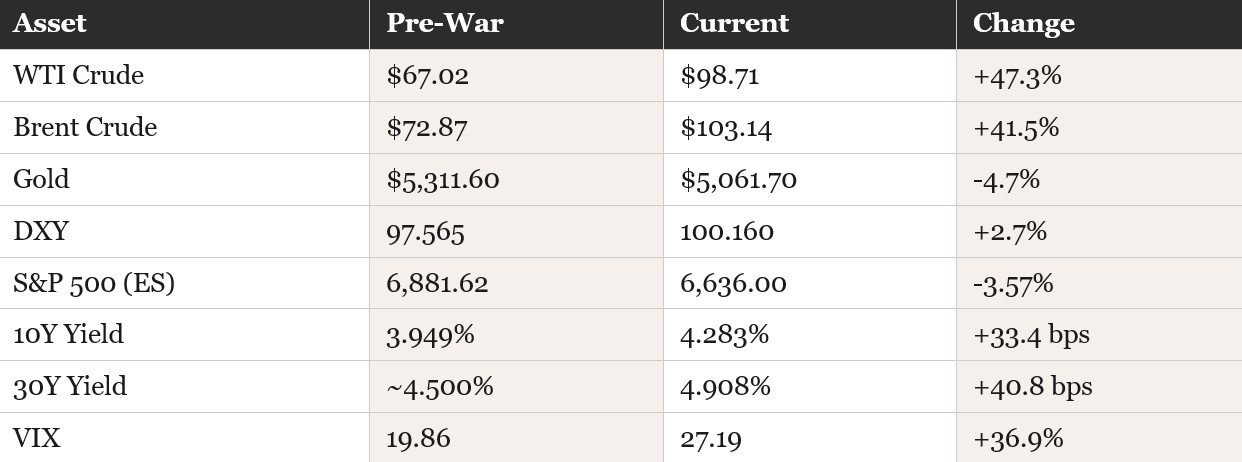
The Numbers Don’t Lie
Total family portfolio: $361,501.12. Down $32,564 from pre-war. Down 8.3% in two weeks. Black Star All Weather Macro: $277,853.95. Options: $18,385.44. Brent crude closed Friday at $103.14 — second consecutive session above $100. WTI at $98.71. Gold crashed 4.7% over five consecutive sessions during an active war. Defense stocks down seven straight sessions while bombs are literally falling. The dollar broke above 100 for the first time since November 2022.
This is not a newsletter that hides from bad weeks. This is what holding conviction looks like when geopolitical shock meets portfolio reality. The thesis didn’t break. The short-term path just got brutal.
But underneath the pain, there’s a pattern anyone paying attention has seen before.
Portfolio Snapshot
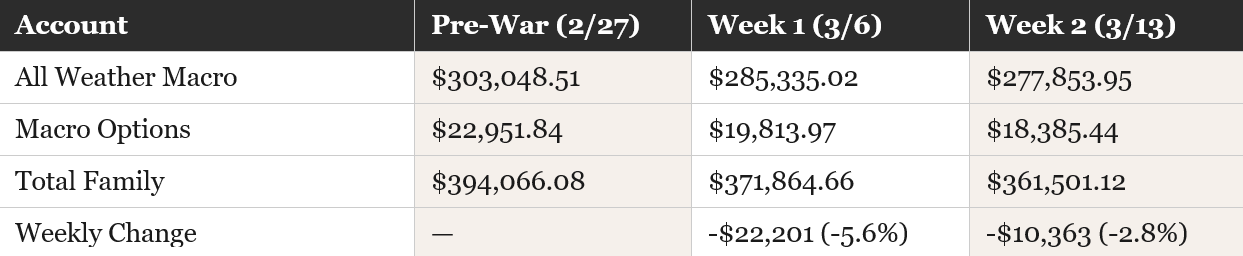
The bleeding slowed — 2.8% this week versus 5.6% last week. But it’s still red. Every position is taking shrapnel from the same storm: crude spiking operational costs, dollar strength crushing foreign conversion margins, and a correlation regime where macro drives everything and stock-picking is dead. COR1M hit 37.21 this week — a new series high. When correlation is that elevated, even the right thesis gets sold.
The Yield Curve Told the Whole Story in One Session
On Friday March 13, the yield curve executed two regime changes in a single trading day. That’s never happened in this series. And it perfectly captures the trap the market is in.
Morning: GDP revised down to 0.7% from 1.4%. The economy was already weak before the war. The 2-year yield dropped 4.3 basis points as the front end priced in rate cuts. Bull steepener — the market briefly believed the growth collapse would force the Fed’s hand.
Afternoon: Oil surged back above $100 (Brent $103.14, +2.67%). The long end resumed its selloff. 30-year yield hit 4.908% — a new series high, approaching 5% for the first time since 2007. The morning’s rate cut optimism was slapped away by the inflation reality of $100+ crude.
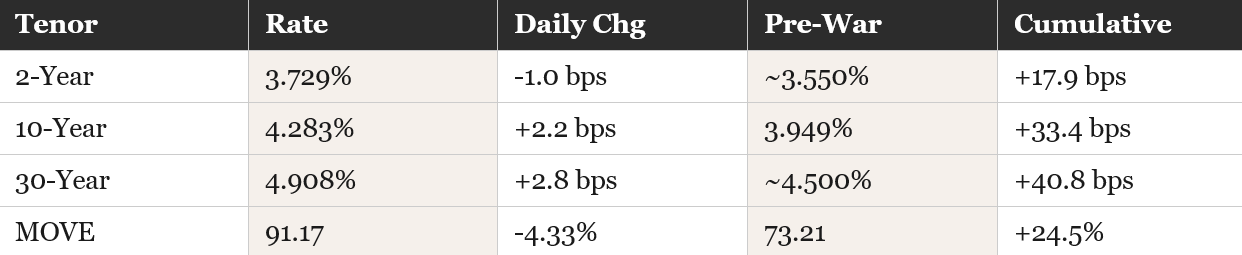
Yield curve regime: Bear steepener resumed. The front end is trapped between growth weakness and inflation. The long end just keeps selling. Core PCE came in at 3.1% — inflation rising while the economy contracts. Consumer sentiment sits at the 2nd percentile of historical readings. Michigan expectations fell 4.4%, with post-war interviews showing sharply higher inflation expectations. The Fed meets Wednesday with an impossible mandate: GDP at 0.7%, Core PCE at 3.1%, oil above $100, and the 30-year approaching 5%. They’ll hold. But the statement language on stagflation is what the market is waiting for.
If you remember Liberation Day last April — tariffs crashed the market, then Trump reversed with a tweet and the market ripped — the pattern is the same. Maximum pain precedes the pivot. The question is always timing, never direction.
DXY Above 100: The Thesis Under Pressure
The dollar broke above 100 for the first time since November 2022. Cumulative gain: +2.7% from the pre-war level of 97.565. That runs directly against the Article 1 thesis — a 60-year DXY chart targeting the 94–95 Fair Value Gap from Trump’s first term.
Let’s be honest about this. The chart says 94. The dollar is at 100.16. That’s a material divergence.
But the DYRH explains why. This is a safe-haven dollar bid during a liquidity crisis where nothing else works. Gold is crashing — down 4.7% during an active shooting war. Bonds are selling at the long end — 30-year at a series high. Equity bounces get sold within hours — Friday’s 78-point ES reversal was the largest intraday swing of the series. When gold can’t rally during a war and bonds can’t rally on a GDP miss, the only trade left is cash. And cash means dollars.
The Scientific Method says: observation changed, hypothesis under pressure, but the structural drivers haven’t reversed. Trump still explicitly favors a weaker dollar. The 60-year political cycle hasn’t changed. What’s changed is a temporary crisis bid that’s overwhelming the structural signal. When Hormuz reopens — and it will, because the US has every incentive to reopen it on their terms — the crisis bid evaporates and the structural thesis reasserts.
This is exactly what happened with the tariff shock last year. Dollar spiked on panic. Then Trump reversed the tariffs. Dollar resumed its decline. Same playbook. Bigger stage.
The Strategy Beneath the Chaos
Here’s what most people are missing. They look at $100+ oil, a crashing stock market, gold selling off during a war, and they see chaos. They see an administration stumbling into an uncontrollable crisis.
That’s not what I see.
Trump has Kevin Hassett and advisers who understand exactly what the price of oil does to the global economy. Hassett publicly quantified the war’s cost at $12 billion this weekend. Trump tweeted last week that the US is the biggest oil exporter and higher prices make us money. He’s not ignoring the oil spike. He’s acknowledging it. He understands the transmission mechanism.
Think about what’s happening from China’s perspective. 80% of Iran’s oil exports go to China. 50% of China’s crude transits the Strait of Hormuz. Trump sanctioned 84% of Iranian tankers. He’s threatening to strike Kharg Island — which handles 90% of Iran’s crude exports. He’s asking China to send warships to help reopen Hormuz. He’s dangling the Xi summit as leverage.
He’s systematically destroying China’s energy supply chain while simultaneously telling them to come help fix it. That’s not stumbling. That’s leverage.
This maps directly to the energy leverage thesis from the @34Macro tweet on January 19th. US geopolitical actions raise delivered energy costs for net importers through shipping and insurance premiums. Hormuz closure is that thesis at maximum amplitude. China and Europe aren’t just paying more for oil — they can’t even get it through the strait. The US has domestic shale, Venezuelan reserves coming online, and EQT natural gas as an alternative supplier. Trump is positioning the US as the only reliable energy source on the planet.
And just like Liberation Day last April, maximum pain precedes the deal. The question isn’t whether he reverses. It’s what concessions he extracts before he does.
China and Europe: Getting Hit Harder
While the US portfolio takes an 8.3% drawdown, net energy importers are absorbing a body blow. The US at least has domestic production capacity. China and Europe don’t.
China: 80%+ of Iran’s oil flows to China. Qatar — the world’s biggest LNG exporter — ships through Hormuz. China gets roughly 50% of all its crude through the strait. With Hormuz closed and Iranian tankers sanctioned, China’s energy lifeline is severed. Russia can’t replace the volume. The alternative supplier is the United States. That’s the negotiation.
Europe: On March 2nd, Macron announced France would expand its nuclear arsenal for the first time in decades and deploy nuclear-armed Rafale jets to 8 European allies — UK, Germany, Poland, Netherlands, Belgium, Greece, Sweden, and Denmark. France and Germany created a high-level nuclear steering committee. This isn’t posturing. Europe is realizing it can’t depend on Middle Eastern energy or indefinite US security guarantees.
Europe’s nuclear escalation creates a second demand driver for your defense positions. RTX, BWXT, KTOS aren’t just benefiting from US military production acceleration — they’re positioned for NATO rearmament. BWXT specifically builds nuclear submarine reactors and weapons systems. When eight European nations sign up for nuclear cooperation, that’s structural demand that extends years beyond whatever happens in Hormuz.
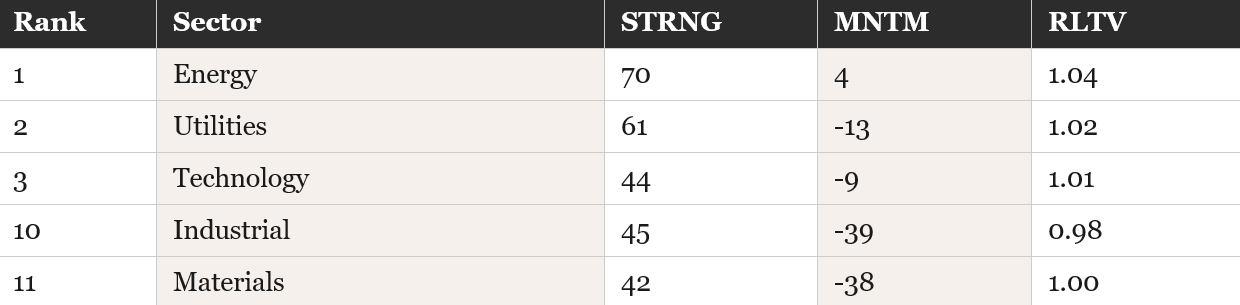
The Quiggle sector rankings confirm: Materials dead last at #11 for the second consecutive week. Industrial at #10. These are the sectors most exposed to the double squeeze — crude spiking eats operational margins, dollar strength crushes currency conversion for non-US miners. But Energy sits at #1. The rotation is telling you where capital wants to be.
What Institutions Are Telling You
The Quiggle rankings from Friday’s close paint a clear picture of institutional positioning.
Sectors (March 13):
Top Assets (March 13):
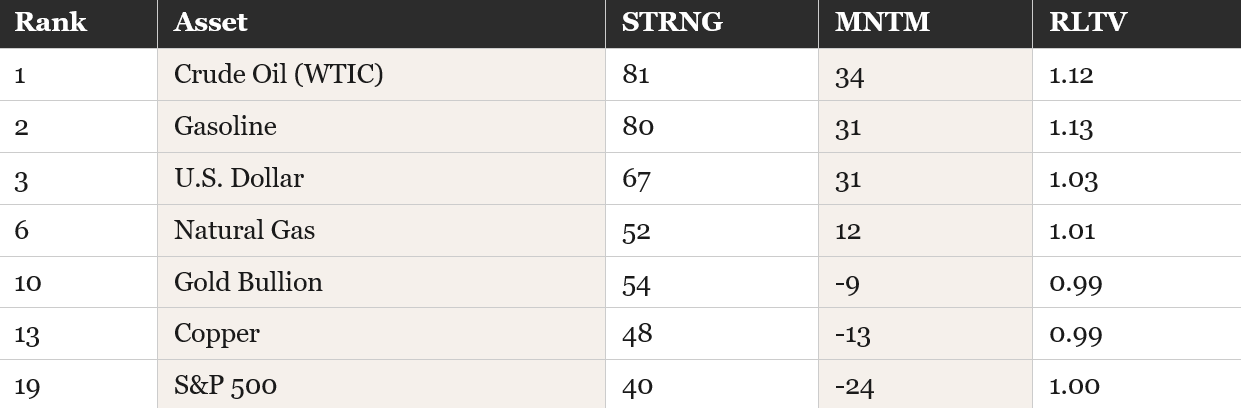
The story: crude oil dominant at #1 with the strongest momentum on the board. Dollar surged to #3 — confirming the safe-haven bid. Gold dropped to #10 with negative momentum. Copper at #13 with negative momentum. S&P at #19. The tape is telling you: energy and cash. Everything else is getting sold.
Industry shift worth noting: Aerospace-Defense collapsed from #7 last week to #28 this week. Seven consecutive sessions of decline during an escalating war. That’s not fundamental — that’s correlation. COR1M at 37.21 means macro is driving everything. When correlation is that high, even the right thesis gets liquidated.
Gold Crashing During a War Is the Signal
Five consecutive sessions of decline. $249.90 in cumulative losses. Gold went from $5,311.60 pre-war to $5,061.70 — a 4.7% drawdown during an active shooting war with $100+ oil, Hormuz mined, and the largest US military operation since Iraq.
This is not a fundamental signal. This is forced liquidation. Margin calls are overwhelming safe-haven demand. When gold can’t rally during a war, nothing is a safe haven except cash. The DYRH flagged GVZ (gold volatility) rising while gold falls — that’s panic selling, not positioning.
We saw a version of this on March 6th — gold reversed higher for one session after four days of forced selling, and GVZ declined. That looked like the liquidation phase ending. Then the next wave of escalation hit and gold resumed selling. The pattern: each wave of escalation triggers another round of margin calls, forcing more liquidation.
When the liquidation finally exhausts itself — and it will, because there’s a finite amount of leveraged gold positions to unwind — the repricing will be violent to the upside. Positions: GLD, NEM, AG, AGI, AU. Holding.
What Earnings Tell You Underneath the Noise
Last week: Broadcom beat on top and bottom lines — EPS $2.05 vs $2.03 estimated, revenue $19.31B vs $19.18B estimated. AI revenue hit $8.4B, up 106% year-over-year. Guided $22B for Q2, crushing the $20.5B consensus. Broadcom’s CEO stated line of sight to $100B in AI chip revenue by 2027. Stock was flat despite the beat — macro overwhelmed the numbers.
Marvell surged 23% on Friday after reporting Q4 revenue of $2.22B with data center revenue hitting a record $1.65B. EPS of $0.80 beat the $0.79 estimate. Custom AI silicon revenue went from near-zero to $1.5B in a single fiscal year. Multiple analyst upgrades followed, with targets raised as high as $140.
The message: AI demand is inelastic even in a stagflationary crisis. Data centers don’t stop building because oil is at $100. That demand is deadline-driven, not price-discretionary — the same dynamic that supports the copper triple convergence thesis.
This week: Thursday March 20th is loaded. Micron (MU) confirms or denies AI memory demand resilience. FedEx (FDX) is the economic bellwether — what shipping looks like with Hormuz closed. Nike (NKE) tells you about the consumer with gas at $3.70/gallon and sentiment at the 2nd percentile. Accenture (ACN) signals enterprise spending. All reporting into $100+ oil, negative NFP, and the day after the FOMC decision.
The Week Ahead: March 17–21
Wednesday March 18th is the fulcrum. Four central bank decisions in 48 hours. The FOMC is universally expected to hold at 3.75%. But the statement language, the dot plot projections, and Powell’s press conference are what the market is trading. If Powell signals the Fed is trapped — can’t cut into $100 oil, can’t hike into 0.7% GDP — that cements the stagflationary regime. If he signals flexibility toward eventual cuts, the front end rallies and every rate-sensitive position gets a bid.
Also Wednesday: Core PPI and PPI before the open. Bank of Canada rate decision. Then Thursday brings the SNB, Bank of England, and ECB all making rate decisions. US unemployment claims (forecast 215K) and Philly Fed Manufacturing (forecast 17.5). New Home Sales. Every data point either confirms or challenges the stagflation narrative.
The war: Day 16 and escalating. Iran’s foreign minister said Tehran has not asked for a ceasefire and is ready for a long war. Israel says it has thousands of targets still to hit and is planning at least three more weeks of strikes. Trump is weighing strikes on Kharg Island oil infrastructure. Brent opened Sunday night around $104–$105. US gas prices at $3.70/gallon, up 24% since the war began. The IEA released 412 million barrels from strategic reserves — largest coordinated release in history — and it’s barely denting prices.
Cumulative Market Moves (Feb 27 close through March 13 close):
Process Over Prediction
Eight point three percent drawdown in two weeks. That’s real money. That’s real pain. Defense down seven straight during a war. Gold crashing during a war. Dollar spiking against the thesis. Materials dead last for two consecutive weeks.
But here’s what I keep coming back to. I’ve seen this playbook before. April 2025, Trump crashed the market with tariffs. Everyone panicked. The framework said lean in, not run. He tweeted “buy” and the market did a complete 180. The people who held through the pain got paid. The people who panicked got left behind.
Thirteen months later, same playbook but bigger. Instead of tariffs, it’s a war. Instead of trade policy, it’s energy policy. But the mechanism is identical — create maximum pain, force the counterparty to the table, then reverse. Trump knows exactly what oil at $100 does to China’s economy. He knows what Hormuz closure does to Europe’s energy security. He’s not stumbling. He’s negotiating.
The structural drivers haven’t changed. The copper triple convergence — military demand, AI infrastructure, construction seasonality — is still intact. Europe’s nuclear rearmament is structural. The 60-year DXY cycle hasn’t reversed. The energy leverage thesis is playing out at maximum amplitude.
The question isn’t whether this reverses. It’s when. And what you’re positioned for when it does.
Until then, you’re at the mercy of the market and Trump and the war. That’s the honest part. You don’t know when the tweet comes. You just know the playbook because you’ve seen it before.
Process over prediction. Data over headlines. Framework over fear.
Glossary
Bear Steepener: When long-term bond yields rise faster than short-term yields. In this context, it means the market is pricing persistent inflation at the long end while the front end is held down by recession expectations. The most dangerous curve configuration.
Stagflationary Twist: A yield curve being pulled apart by two competing forces — recession at the short end (rate cuts) and inflation at the long end (oil prices). The signature of a 1970s-style supply shock.
COR1M: One-month implied correlation. When above 30, it means macro is driving everything — individual stock analysis is essentially irrelevant. At 37.21, it means zero stock-specific alpha is available.
Forced Liquidation: When leveraged investors receive margin calls and must sell assets regardless of fundamental value. This is why gold can crash during a war — the selling isn’t about gold’s safe-haven status, it’s about meeting cash demands elsewhere.
MOVE Index: Bond market volatility. Above 80 indicates crisis-level bond dislocations. At 91.17, the bond market is in significant stress even as it moderates from the 95.30 peak.
Fair Value Gap (FVG): A price imbalance on the chart where price moved so quickly it left an unfilled zone. The DXY FVG from Trump’s first term sits around 94–95 — the thesis target that the current crisis bid is temporarily overriding.
Kharg Island: Iran’s primary oil export terminal, handling approximately 90% of the country’s crude exports. Trump is weighing strikes on its infrastructure as additional leverage.
34 MACRO
Cross-asset macro research and education — built for the everyday person.
The information on this website/Substack is for information purposes only. It is believed to be reliable, but 34 Macro does not warrant its completeness or accuracy. The information on the website/Substack is not intended as an offer or solicitation for the purchase of stock or any financial instrument. The information and materials contained in these pages and the terms, conditions and descriptions that appear, are subject to change without notice. Unauthorized use of 34 Macro websites and systems including but not limited to data scraping, unauthorized entry into 34 Macro systems, misuse of passwords, or misuse of any information posted on a site is strictly prohibited. Your eligibility for particular services is subject to final determination by 34 Macro and/or its affiliates. Investment services are not bank deposits or insured by the FDIC or other entity and are subject to investment risks, including possible loss of principal amount invested. Your use of any information which is proprietary to 34 Macro or a third-party information provider shall only be used on individual devices without any right to redistribute, upload, export, copy, or otherwise transfer the information to any centralized interdepartmental or shared device, directory, database or other repository nor to otherwise make it available to any other entity/person/third party, without the prior written consent of 34 Macro.
Subscribe at 34macro.substack.com